

Aims: We previously reported results of the first machine learning study to identify the novel biomarkers associated with crude incidence of TEs in PV patients (pts) treated with hydroxyurea (HU) (Verstovsek et al, Blood 2019). In the current study, we have expanded the database to perform an in-depth machine learning analysis of biomarkers predicting the annual standardized incidence rate (IR) of TEs in PV pts treated with HU. In addition, we examined the IR of TEs in HU-treated pts and pts treated first with HU, then switched to ruxolitinib (HU-RUX).
Methods: The study is part of PV-AIM (polycythemia vera advanced integrated models for prevention of TEs). The US OPTUM database includes the electronic medical records from 105 million pts (2007-2020), including 82 960 PV pts with a median record length of 8.4 years. TEs were assessed (A) before the treatment (Tx) initiation in both groups; (B) while on HU (median: 29 months) and (C) while continuing HU or switching to RUX (median, 17 months).
A total of 3852 HU-alone pts and 130 HU-RUX pts passed inclusion/exclusion criteria. To avoid selection bias, only HU-alone pts treated prior to RUX market launch were included (n=704). Cohorts were then matched by selecting the nearest cases from the HU-alone groups based on the propensity scores calculated from the total Tx period, gender, race, age at index, and geographical division (n=130 pts in both HU-alone and HU-RUX). TEs were identified from a restrictive list of ICD-CM diagnosis codes defined in the RESPONSE study (Kiladjian et al, Lancet Haematol 2020). Annualized IR of TEs were then calculated per 100 pts for each of the above Tx periods for each cohort.
A random survival forest (RSF) model was then constructed for HU-alone pts, with at least 6 months of HU Tx and 18 months of follow-up, to predict the risk of TEs 6 to 18 months after the first HU Tx. Pts with at least 1 lab test and 1 observation obtained at 3 to 6 months post index were included in the model (n=1012). The features also included demographics, history of TEs, phlebotomy and anti-coagulant use. The performance was assessed on a 70:30 train:test split using Receiver Operating Characteristic-Area Under the Curve (ROC-AUC). RSF variable importance was then used to identify the variables with the largest impact on prediction of TEs. The feature interactions for the top 10 features were mapped and assessed in terms of risk of TEs via log-rank using a brute-force combinatorial approach. Risk was assessed in the context of total population and in pts with/without a history of TEs. Optimal interactions were presented as interpretable 4-group Kaplan-Meier plots. Lastly, the feature interactions were scored for synergy in the context of risk of TEs based on the difference in expected and observed pairwise probabilities.
Results: The RSF model achieved an accuracy of > 0.80 AUC for prediction of TEs 6 to12 months after the first HU Tx. RSF variable importance revealed that the history of TEs had the largest effect on prediction (>2-fold) relative to other features. The top observational and lab variables in terms of feature importance were body mass index and neutrophil percentage (NEP), respectively, followed by the previously observed lymphocyte percentage (LYP) and RDW.
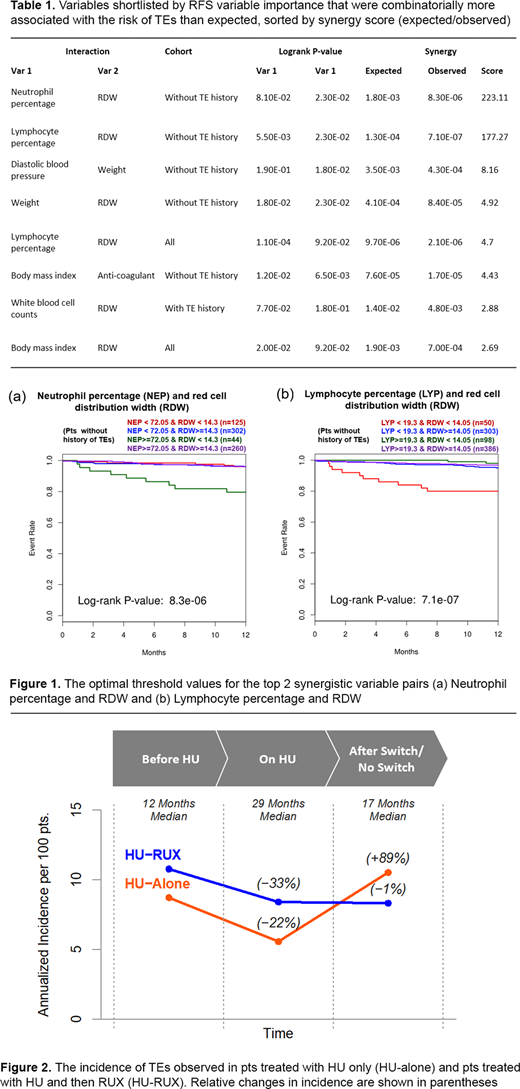
The largest synergistic pairwise interactions (Table 1) were NEP + RDW (Figure 1a), followed by LYP + RDW (Figure 1b), which occurred in pts without history of TEs.
The pre-Tx baseline incidence of TEs in the HU-alone and HU-RUX groups were 8.7 and 10.8, respectively. The rates of TEs decreased by 36% and 22% to 5.6 and 8.4, respectively during the HU Tx. Following the switch to RUX, the rate of TEs was maintained in the HU-RUX group at 8.3 (−1%) but increased to 10.53 (+89%) in the HU-alone group during the same period of 17 months (Figure 2).
Conclusion: An in-depth machine learning analysis to identify the markers that predict TEs in HU-treated PV pts revealed interaction of key hematological parameters with RDW. This finding could help recognize the pts at high risk of TE and possibly prevent a major cause of morbidity and mortality. The results reconfirm the role of RDW, as well as NEP/LYM ratios in predicting TE occurrence, routine lab parameters in the clinic, but not usually taken into account. Finally, we observed a renewed increase in TEs in HU-treated pts after an initial decrease, which was not the case in pts switching to RUX in the same period. We aim to present similar biomarker analyses on RUX pts in the final presentation.
Verstovsek:Promedior: Research Funding; NS Pharma: Research Funding; PharmaEssentia: Research Funding; Novartis: Consultancy, Research Funding; Sierra Oncology: Consultancy, Research Funding; AstraZeneca: Research Funding; Blueprint Medicines Corp: Research Funding; Genentech: Research Funding; CTI Biopharma Corp: Research Funding; ItalPharma: Research Funding; Incyte Corporation: Consultancy, Research Funding; Protagonist Therapeutics: Research Funding; Roche: Research Funding; Gilead: Research Funding; Celgene: Consultancy, Research Funding. De Stefano:Janssen Cilag: Other: Non-financial support; Celgene: Other: Non-financial support, personal fee; Bayer: Other: Non-financial support; Amgen: Other: Personal fee; Novartis: Other: Personal fee, Research Funding. Heidel:Novartis: Consultancy, Honoraria, Research Funding. Zuurman:Novartis Pharma A.G.: Current Employment. Zaiac:Novartis: Current Employment, Current equity holder in private company. Bryan:Novartis: Current Employment. Buckley:Novartis: Current Employment. Mathur:Novartis: Current Employment. Morelli:Novartis: Current Employment. Bigan:Novartis: Consultancy. Ruhl:Boston Consulting Group: Current Employment. Meier:Novartis: Consultancy.

This feature is available to Subscribers Only
Sign In or Create an Account Close Modal